
Alex Villacorta: Spheres of Influence
Artist(s):
Collaborators:
Title:
- Spheres of Influence
Exhibition:
Creation Year:
- 2007
Category:
Artist Statement:
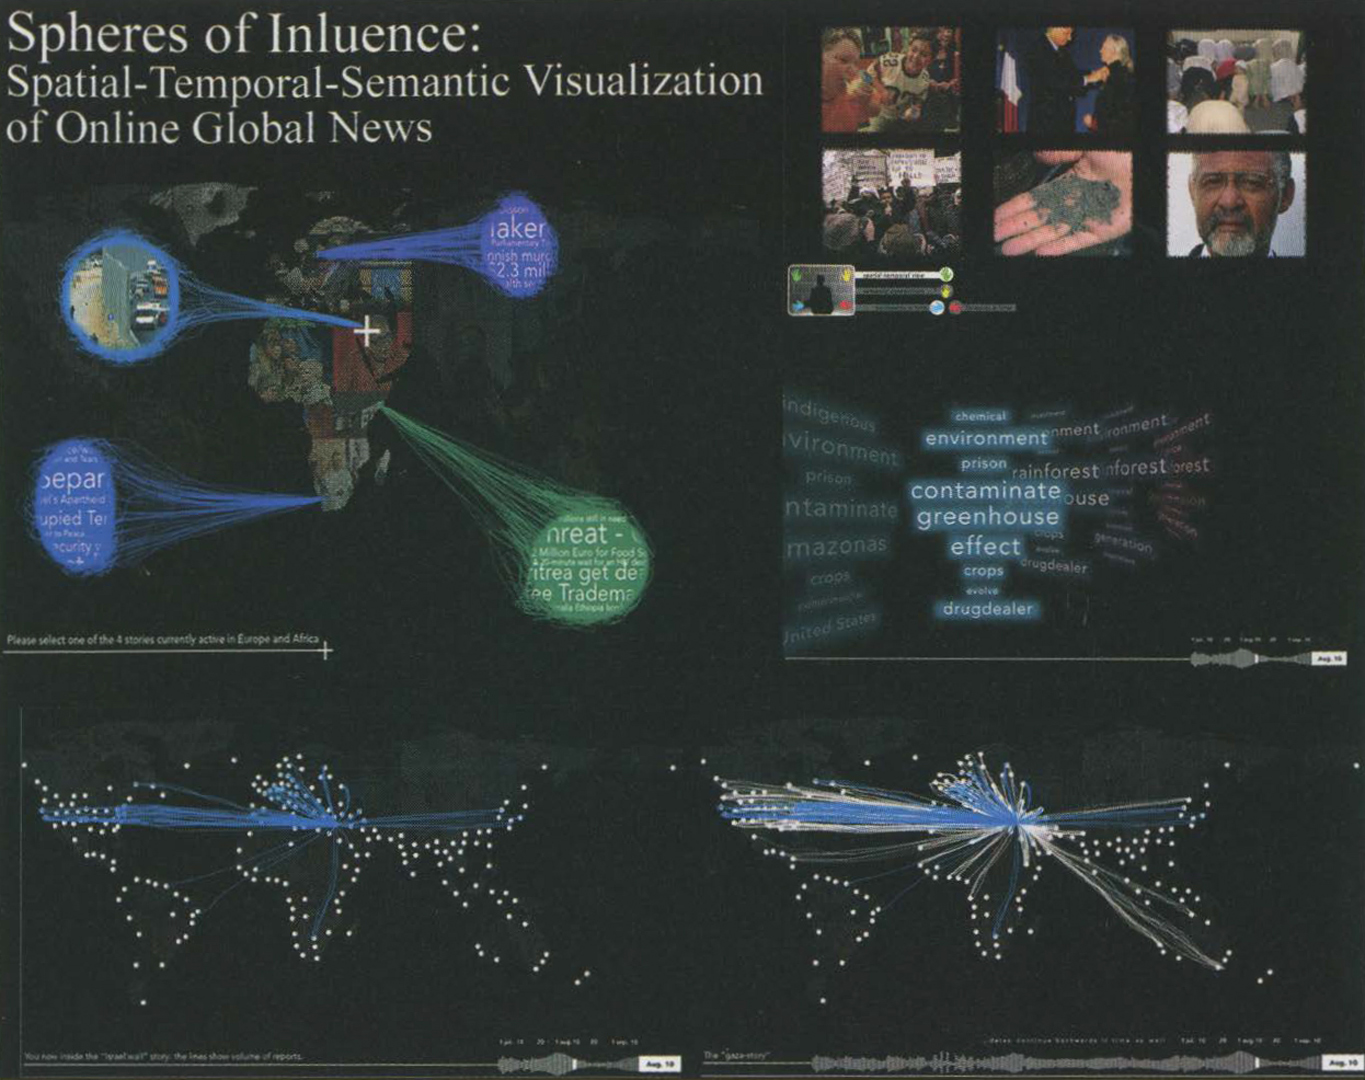
The Spheres of Influence (SOI) project is an interactive digital art and information exhibit that visualizes the content and distribution of online world news. News, in the form of narratives and images describing current events, is a vital class of information, which is produced and consumed continuously in time and space. People from all parts of the world rely on news outlets to present relevant reporting on issues that are important to them. However, the topics that are important to one class of people often differ significantly from on another. To illuminate this difference in perspective, the SOI project measures, compares, and visualizes the importance different countries, geographic regions, and language groups place on news stories, based on volumes of reports and the locations of the organizations disseminating them. The main objective is to present the general public with an immersive space that allows for exploration of global news coverage within the temporal, spatial, and semantic properties of the reports. Traditional media sources are often rooted in ethnocentric points of view, but when viewers can visually and spatially interact with the distribution of global news, they may gain a better understanding of the topics important to different cultures. Finally, the news data obtained from this ongoing operation of the installation are captured and maintained as a valuable data source of global information flow. Our goals reflect the interests of seven student researchers from the fields of statistics, geography, computer science, electrical and computer engineering, psychology, and art in addressing the content of web news reporting and the interactive installation (navigation by means of users’ movement in the exhibit space).
Technical Information:
The physical layout of the SOI installation space consists of four side-by-side widescreen LCD monitors with four overhead cameras tracking user movement. The system was implemented in C++, Python, OpenGL, and OpenCV totaling over 6,000 lines of code. Users navigate by moving in the space, literally stepping into news stories of global interest and exploring several possible paths, including the distribution and magnitude of reporting, as well as temporal changes to both its quantity and content. A PostgresSQL database is filled with data by automated scripts that collect and cluster news reports from the internet. Using the spatially enabled features of the GIS database, the system maps the source and subject locations of the stories and adds animated graphic elements that indicate connections between them. Because the system is modal, the information that needs to be processed and displayed depends on the position and actions of users. The challenge of this implementation is efficiently coordinating the various subsystems of the installation to create a seamless user experience.