
DAC Online Exhibition 2018: Designing Knowledge
Chair(s):
- Lily Diaz-Kommonen
-
- Aalto University
- Tania Rodríguez-Kaarto
-
- Aalto University
Art Show Overview:
INTRODUCTION
The collection of works presented in this exhibition comprises objects that come to be as result of, or through information processing and knowledge making practices. They are exemplars of the intensified use of electronic media processing that has brought information into the level of being a key exchange value on a planetary scale. Within the myriad details in our everyday life, including the affective, the biological, the educational, the social and the political among others, information crafting – that is the ‘working on’, the ‘thinging’, or objectification, the form-giving, and reification into knowledge artifacts and infrastructures now inheres in every human production activity, from the scientific to humanistic and the artistic.1. EVERYWHERE AND NOWHERE
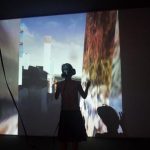
As placeholder electronic repositories such as the ones presented here play a key role both structuring and instantiating imaginative activities involved in information and knowledge production. In these constellations, complex tools are utilized to sift, separate and re-assemble the diverse components. Establishing distinction and similarities elements are re-imagined according to hierarchical levels such as those exemplified by tree-like configurations (Lima). They are gathered and classified into neat adjacent box-like structures and placed horizontally and vertically into matrices to reveal boundaries and intersections (Bertin). Or even assembled contiguously as networked tentacles forging ahead through electronic space (Moretti).They coalesce and become reified in information repositories and online archives often bearing their own systemic and ecological configuration. They are objects of design. Or concretized virtual constructions that once in operation recede to the background: As we peruse through them, engage in our human practices with them, they both adapt to and influence our perception. Marc Lee’s 10.000 Moving Cities – Same but Different enables us to move through virtual worlds resulting from others perceptions and imaging practices. A diagrammatic rendition or virtual framework of a city is used as contact point to (re)locate and project images posted by others in social networks such as Youtube, Flicker and Twitter. The interactive journeys accomplished using a head mount display and wireless controllers provide image and sound collages of local, cultural and linguistic differences and similarities.
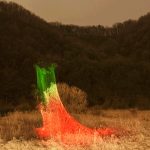
Information itself however, is not to be conflated with knowledge. As Gitelman has noted, knowledge is not static but rather dynamic. Partly the result of processes involved in our searching and apprehending the world, information is created relationally and through engagement. Knowledge involves people, artifacts and institutions coming together, interconnecting in complex ways for the sake of further instantiation, maintenance, preservation and dissemination. This can be examined in the Invisible Spot project where the new, as in electron microscope photography used to penetrate into the core of matter, is combined with the distant, as in the centuries old Korean paper-making tradition of Hanji where individual sheets of paper are made from the inner bark of the dak tree[1]. The works reveal imagined virtual sites of nature. The artworks produced in this manner are displayed in the traditional manner of two-dimensional photography works depicting places that because of their contingency, are both nowhere and everywhere.
2. MATERIALITY AND HISTORY IN VIRTUAL SPACES
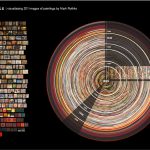
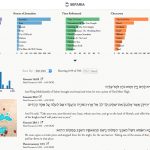
From historical preservation and dissemination to interactive visualizations of art, history to discourse analysis and information processing, the works presented deal with the structuring of knowledge in such way to enable diverse viewpoints. From this perspective we have the Sefaria archive an online open source and Creative Commons oriented work that situated firmly in the textual tradition of Jewish learning through the Talmud–the ancient meaning of the term is ‘to teach’, ‘to study’–focuses on interconnectedness of the texts and the polyvocality (as in multiple voices) of co-presentation. Sefaria makes use of a diversity of statistical analysis methods and information graphics formats to present this polyvocality to its audience. The materiality of information is palpable in its metaphoric use of paper sheets: Educators using Sefaria follow the ancient tradition of annotation to add commentaries to the main texts of the Talmud. They create electronic sheets to gather their materials. These sheets can be shared and published, thus providing glimpses regarding the topics of interest and discussion in the diverse user communities engaged with Sefaria.RothkoViz brings together a sample of 201 paintings by Latvian born and American grown artist Mark Rothko. As least 50 properties, such as shape form and the use of color by the artist are examined using statistical analyses and the perspectives of different spatial configurations affordable through computer graphics. A 2D polar plot for example, allows one to appreciate the differences in Rothko’s use of color from his early works in the 1920s to his last works in the 1970s. The circular shapes of the plot remind one of the tree rings examined in dendrochronology. Perhaps each of the paintings is a ring that stands as one observation event in Rothko’s life.
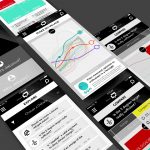
Location-based data and details of a life in transit empowered the author of Tracking Transience. Here the quantification of the things we do, of where we go, and what we eat became a logbook where life happenings were pieced together and catalogued into different databases that accurately profiled its author. Contrary to reasonable logic, the methodical, incisive and all-encompassing exposition accessible through the mapping of one’s own life granted the artist Elahi Hasan an “anonymous and private life”, giving way to a new way of perceiving information and its real value. Among the questions emerging from this work are: What roles do individuals and communities assume in memory making and forgetting? How are these roles related to ongoing societal challenges?
In this undertaking of information crafting Mapping LGBTQ St. Louis digitally charts space and sexual segregation between 1945-1992, evidencing the interrelationship between metropolitan spaces, gender and ethnicity through policies, violence and colliding socioeconomic facts. Combining archival documents and GIS data it unveils the intricacies of race and sexuality shedding light to its socially constructed codings and continuously evolving subtleties. Mapping LGBTQ St. Louis weaves an alternative view nurtured by the communities’ participation reflecting the power of institutional discourses over human sexuality, how and where they connect and lose each other.
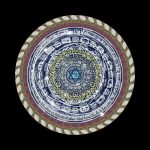
3. MICRO AND MACRO COMPLEXITY
Visualizations about mythology, cosmology, heritage, art, music and science combined with information technology and user generated content conjure redesigned representations of unique personal and shared experiences. It is through interaction and participation—topics at the center of many of the works showcased here—that data is harvested to uncover trends and hidden patterns that are a consequence of our interactions and also shape our behaviour. The diaspora of shareable scripts that bring organisms to life, which are sensitive to the surroundings and our movements make Living Mandala a representation of how historical, cultural and scientific imagery intertwine with real-time data giving form to our perceptions of life and of the universe.Complexity is an implicit undercurrent in the Designing Knowledge exhibition and a common thread across the works here compiled—in terms of how they introduce the most comprehensive representations of something and simultaneously deal with constant change—. Such is the case of Massive is light where through the use of two platforms (Debate Inside and Faveeo) Big Data and personalized information flow are challenged by the development of new tools meant to deal visually with information overflow and complexity by the drafting new visual language guidelines extracted from the user’s gestures, and behavior and in turn having the users contribute to the architecture of infographic tools. In a similar way Aesthetics of Two Worlds aims to show us how aesthetics can be evoked in the statistical processes involved in big data manipulation.
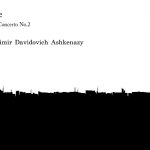
In the quest for uniqueness and innovative ‘form-giving’, works such as Music Skyline compare two sets of sound data, to create a city skyline style visualization of Sergei Rachmaninov’s piano concerto No.2 Op.18 by two different interpreters. It makes a comparison of two sets of unique musical tracks with their own characteristics that like fingerprints are unique to each player, in turn, each players’ score creates a unique skyline visualization of their interpretation just as unique as a city’s skyline.
4. SIMILARITY AND DIFFERENCE
Curating or gathering a collection is also another form of information crafting. The term collection refers to a set whose elements have been arranged according to a particular order or following certain conceptual principles. Our objective in organizing this exhibition has been to engage in the type of relational thinking that philosophers such Karen Barad have described. Thus, the exhibition opens up to a page that shows the different works plotted on a Self-Organizing Map, SOM map. An algorithm and also (in our view) an information graphic representation, SOM is based on artificial neural networks (ANN) technology. The SOM algorithm was invented by Teuvo Kohonen a Finnish scientist who claimed that the SOM is similar to the map of the brain which represents the spatial data of the electrical neuron responses.Our work with SOM focuses primarily on the creative use of this technology.[2] For this iteration the map allows us to visualize interrelations between the different projects included in the exhibition. Metadata submitted with each of the works was used to create a ‘soft ontology’ of the collection (Avilés Collao et al.). Subsequent to this, properties from this ontology were assigned to each of the artefacts in the exhibition. Encoding the data to yield the SOM map was done using the SOM Tool created by Hung Han Chen and the Systems of Representation research group.[3]
Engaging with our SOM map shows how pressing the Science tag displays the Invisible Spot, Living Mandala and the Music Skyline works. Indeed, Jin Wan Park, describes himself as an artist and scientist engaging in new forms of artistic expression “only possible through scientific research”. The thought that comes to mind is whether it would be possible to also do science through art?
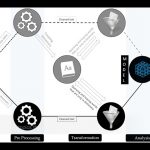
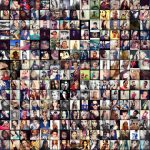
Aside from being data repositories, the project’s themselves can be regarded as advanced information processing artefacts. Data is obtained by deploying strategies according to a series of criteria and it is processed and converted (transduced) into something new. Among the diverse procedures used to achieve the transformation Selfiecity’s use of Mechanical Turk to assemble data and Mapping LGBTQ St. Louis data gathering as act of remembrance of human rights struggles stand out in a Romantic juxtaposition: In the 21st century, cities such as Bangkok, Berlin, Moscow, New York, and Sao Paulo (the cities included in Selfiecity) are not just physical sites where decaying infrastructures meet virtual marketplaces with questionable labour practices. They are also habitats with places that gather human histories. Thus, Mapping LGBTQ St Louis’ shows us the site of the 1986 protest organized by Women Rising in Resistance, or the location where Moonstorm, a lesbian newspaper that flourished during the years 1973–1983, was printed. And the 82% smiling females in Moscow compared to the 52% in Bangkok of Selfiecity ushers an insightful moment when we can imagine–as well as regard–their fleeting gestures.
CONCLUSION
Electronic repositories like the ones showcased here, are now an important part of how knowledge is constructed in the age of Big Data. They assist our sense-making of the abundant and readily amount of information that sometimes hinders our understanding. As objects of design, these information artefacts, are and will become essential building blocks with which we constantly reconfigure the world and design knowledge.
Committee(s):
- Susanne Hazan
-
- Israel Museum of Jerusalem
- Conner MacGarrigle
-
- Dublin Institute of Technology
- Rasa Smite
-
- University of Liepaja
General Committee:
Website:
https://designing-knowledge.siggraph.org/wp/
Additional Information:
SOURCES
Aviles Collao, Jazmin, Diaz-Kommonen, Lily, Kaipainen, Mauri, Pietarila, Janne, “Soft Ontologies and Similarity Cluster Tools to facilitate Exploration and Discovery of Cultural Heritage Resources”, in Proceedings of DEXA 2003, 1-5 September 2003, Prague Czech Republic, IEEE Computer Society Digital Library, pp. 75–79.
Bertin, Jacques, Semiology of Graphics. Diagrams, Networks, Maps, (Redlands, CA: Esri Press, 2011).
Chen, Hung-Han, SOM Tool, https://sysrep.github.io/somtool/, (Accessed 19 April 2017.)
Gitelman, Lisa (Editor), Raw Data is an Oxymoron, (Cambridge, MA: The MIT Press, 2013).
Kohonen, Teuvo, “The Self-Organizing Map”, in Neurocomputing, Vol. 21, Issue 1, 1998, pp. 1–6.
Lima, Manuel, Visual Complexity: Mapping Patterns of Information, (Princeton, NJ: Princeton Architectural Press, 2011).
Moretti, Franco, Graphs, Maps, Trees. Abstract models for Literary History, (London, UK: Verso, 2005).
Soft ontology, Wikipedia, https://en.wikipedia.org/wiki/Soft_ontology, (Accessed 26 April 2018.)
[1] Lee, Aimee. 2008. Making hanji: Korean paper-making by Shin Hyun Se, https://www.youtube.com/watch?v=1_nWOO10ODk, accessed 14. April 2018.[2] Interest in SOM and ANNs at Media Lab Helsinki dates back to the late 1990s and early 2000s with Timo Honkela’s and Mauri Kaipanen’s tenure as professors.
[3] Hung Han Chen is a doctoral candidate at Aalto University. His work on SOM is part of his thesis about affective archives.
Acknowledgements:
WEBSITE DEVELOPMENT & IMPLEMENTATION
Johannes Neumeier – Aalto University
Jim Demmers – ACM SIGGRAPH Digital Arts Community site administration
Victoria Szabo – Duke University, ACM SIGGRAPH
Exhibition Artworks:
-
10.000 moving cities - same but differen...
[Antonio Kleber Zea Cobo] [Florian Faion]
Categories: [Augmented Reality/Virtual Reality] -
Aesthetics in Two Digital Worlds
[Ossi Naukkarinen] [Darius Pacauskas]
Categories: [Internet Art] -
Invisible Spot
[Ji Hojang]
Categories: [2D & Wall-Hung] -
Living Mandala
[Jing Zhou]
Categories: [Animation & Video] [Interactive & Monitor-Based] -

Mapping LGBTQ St. Louis
[Andrea Friedman] [Miranda Rectenwald]
Categories: [Internet Art] -
Massive is Light
[Romain Collaud] [Andreas Sonderegger]
Categories: [Design] -
Music Skyline
[Yang Kyu Lim] [Jin Wan Park]
Categories: [Design] [Interactive & Monitor-Based] -
RothkoViz
[Everardo Reyes]
Categories: [Internet Art] -
Sefaria - A Living Library of Jewish Tex...
[Lev Israel] [Brett Lockspeiser]
Categories: [Internet Art] -
Selfiecity.net
[Lev Manovich] [Moritz Stefaner]
Categories: [Internet Art] -

Tracking Transience
[Hasan Elahi]
Categories: [Internet Art]