
Everardo Reyes: RothkoViz
Artist(s):
Title:
- RothkoViz
Exhibition:
Category:
Artist Statement:
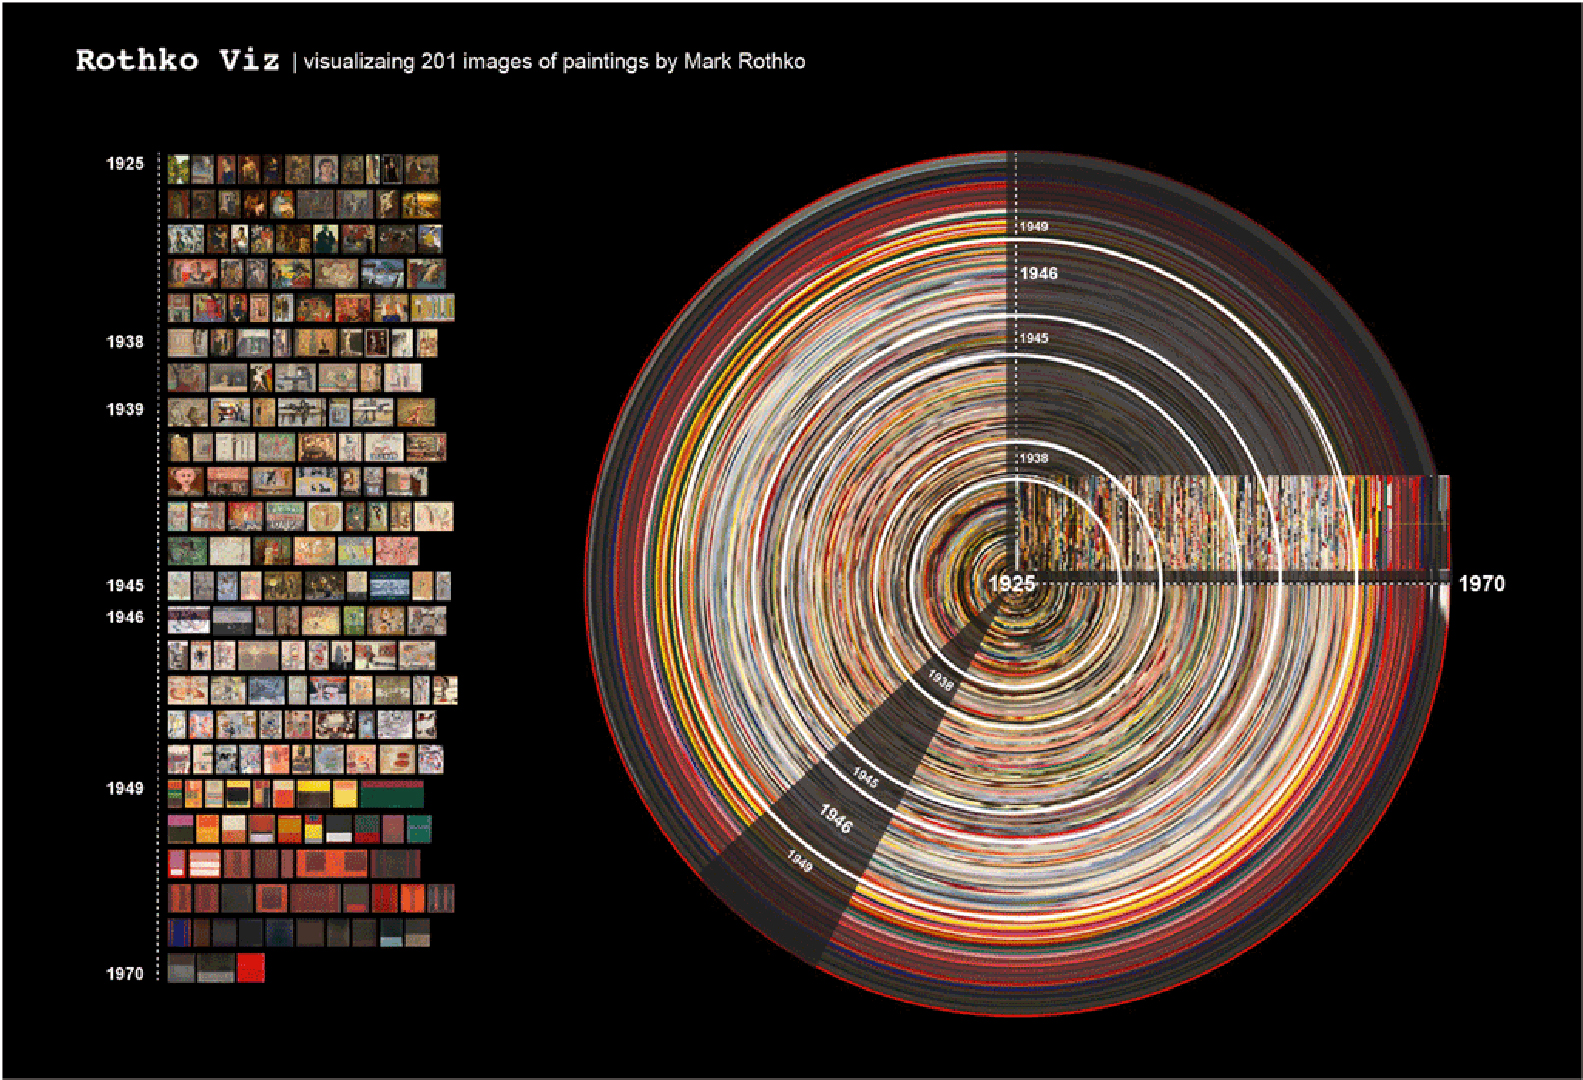
RothkoViz is an online visualization program that organizes 201 images of paintings by Mark Rothko. It offers three ways of exploring data: 2D image plots, 3D interactive spaces, and some image generators.
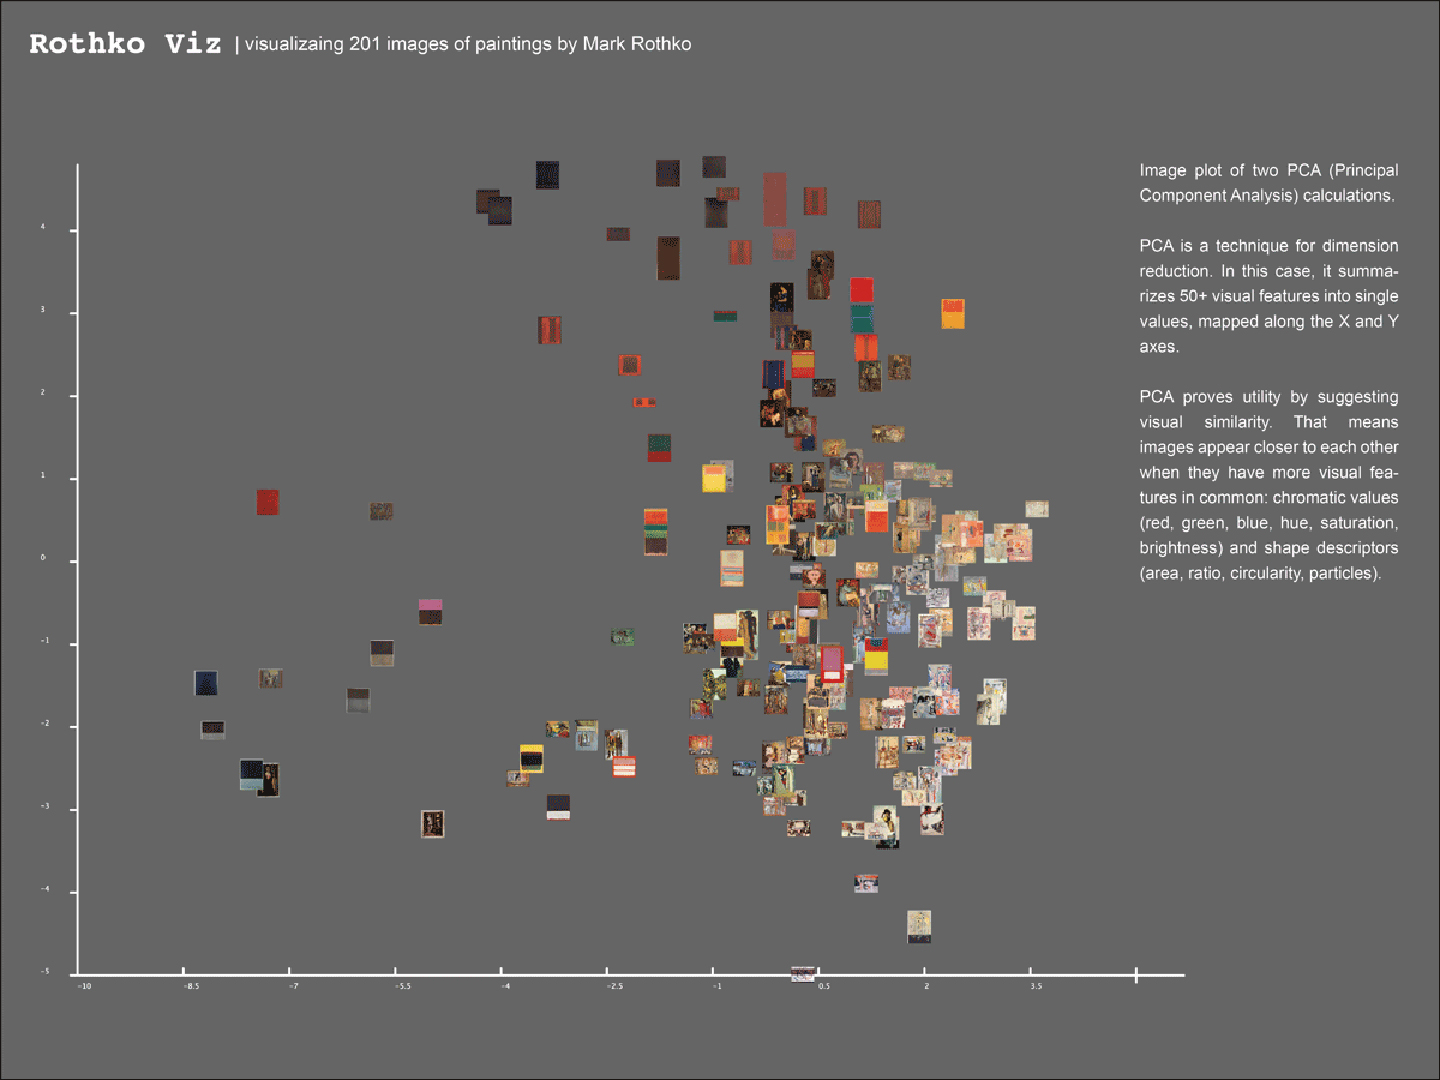
The first visualization method is presented as simple large static images. One of them localizes crossings on the Cartesian plane that summarize 50+ visual features. The dimension reduction is achieved with a Principal Component Analysis (PCA) calculation. The other image shows an orthogonal view of our archive (which means cropping every image into thin slices), but this time in a polar Cartesian plane. Statistic operations were made with Mondrian and image plots with ImageJ. The expected viewer reactions include understanding image transformations and experimental spatial representations of the same archive that might highlight visual patterns.
The second manner uses extensively WebGL as a graphics engine to explore and navigate the corpus. I first plotted chromatic values as color points with P5.js. The extraction of red, green, and blue values was made with image processing tools included in ImageJ. Then I plotted those values following the RGB color model (a cube whose vertices stand for black, white, red, green, blue, yellow, cyan, magenta). While the first plot rightly depicted color values, I was more interested in displaying the images themselves. For this reason I adapted code with the three.js library to create a virtual environment. After a user session, she could orbit within a virtual world of images floating around the space.
The third case consists of a simple image generator of Rothko styles, using only JavaScript, CSS and HTML. This generator is based on a hand-made description of the main shapes and color rules that characterize a Rothko style at a certain time of his career. In our program every time the user clicks the image, the program randomizes the rules and shows a new model. It could be of course that at some point the generator will produce the same combinations used by Rothko, nevertheless, it fulfills its function as long as a viewer identifies a generated image with Rothko’s style.
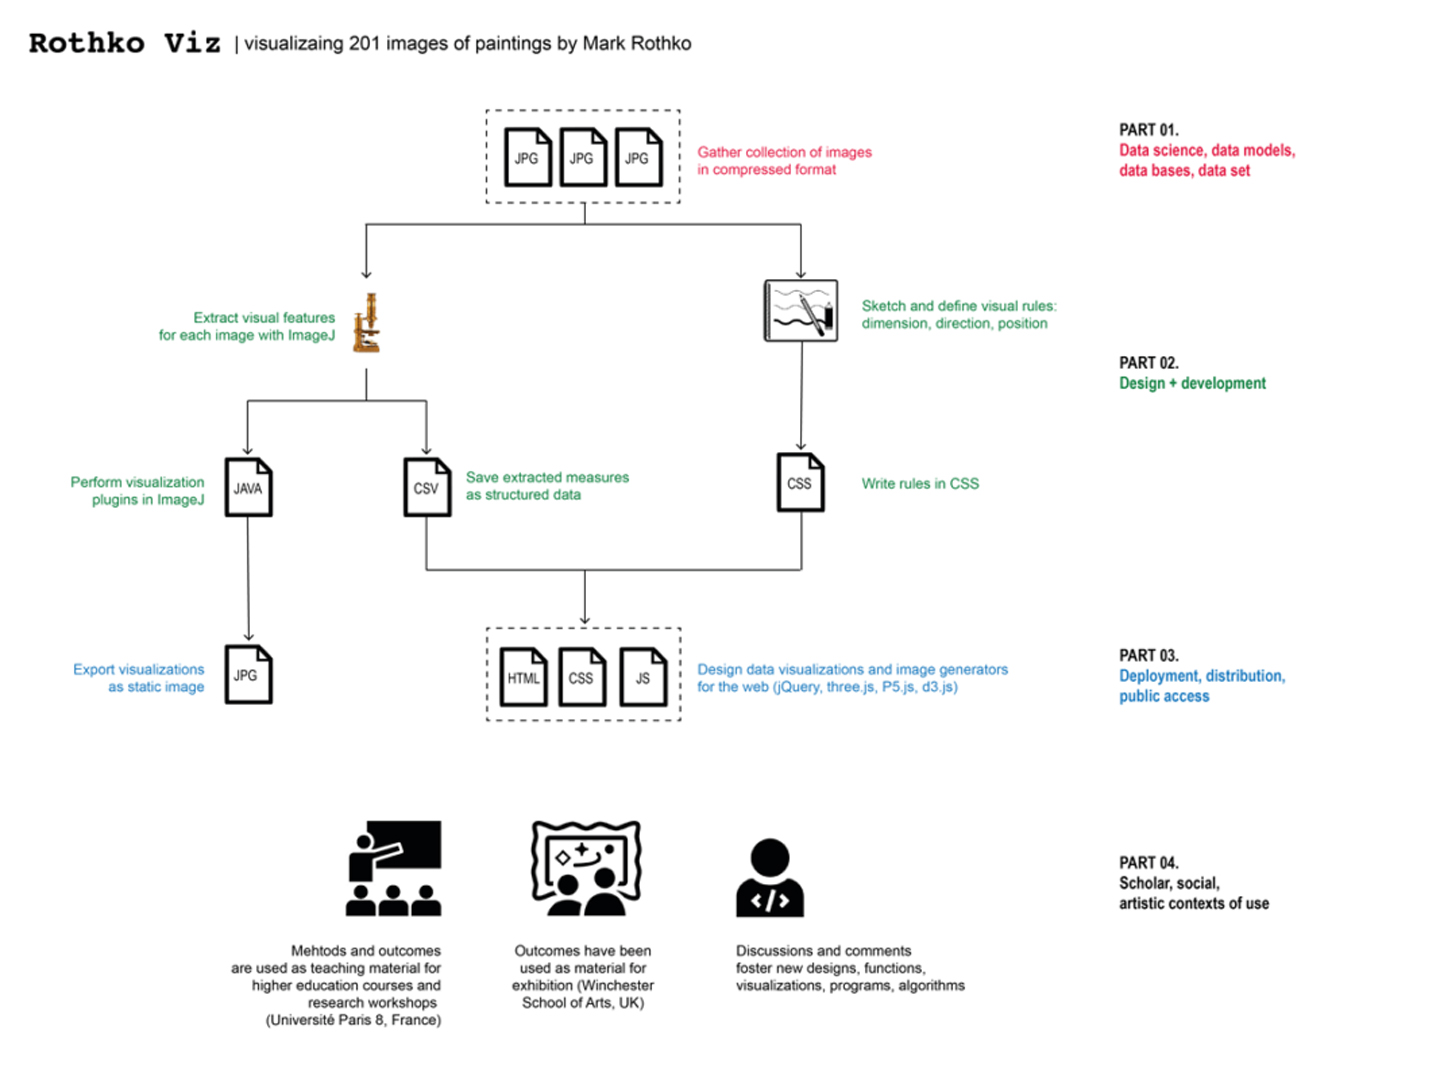
Technically speaking, data was obtained from The National Gallery of Art website (http://www.nga.gov/, Washington, DC). Data was extracted from the web with free tools such as import.io. Visual features extraction and quantification was made with ImageJ and Cultural Analytics Lab tools. Data was cleaned and processed with several tools: MS Excel, Google Spreadsheets, Open Refine, Mondrian. Web development was made with Atom editor.
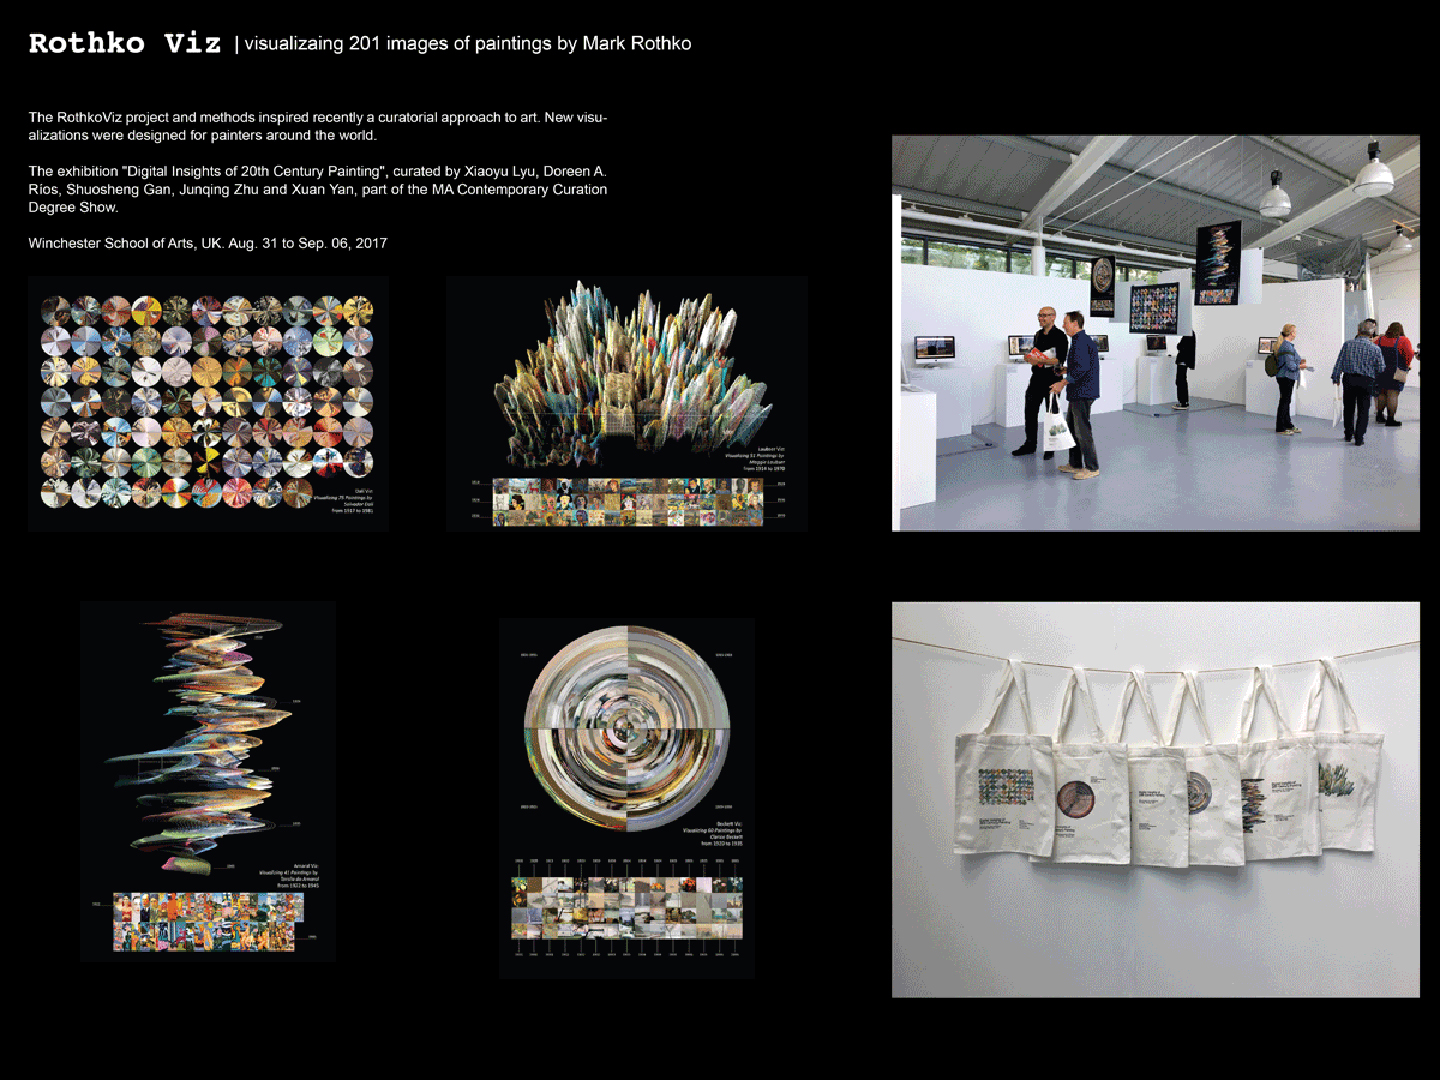
The methods and lessons learned from the project are used regularly in higher education courses on data visualization. Moreover, it inspired recently an exhibition at the Winchester School of Arts, as a curatorial approach to art and data. https://anti-materia.org/a-curatorial-approach-to-dataviz-eng