
Miranda Rectenwald: Mapping LGBTQ St. Louis
Artist(s):
Title:
- Mapping LGBTQ St. Louis
Exhibition:
Creation Year:
- 2017
Category:
Artist Statement:
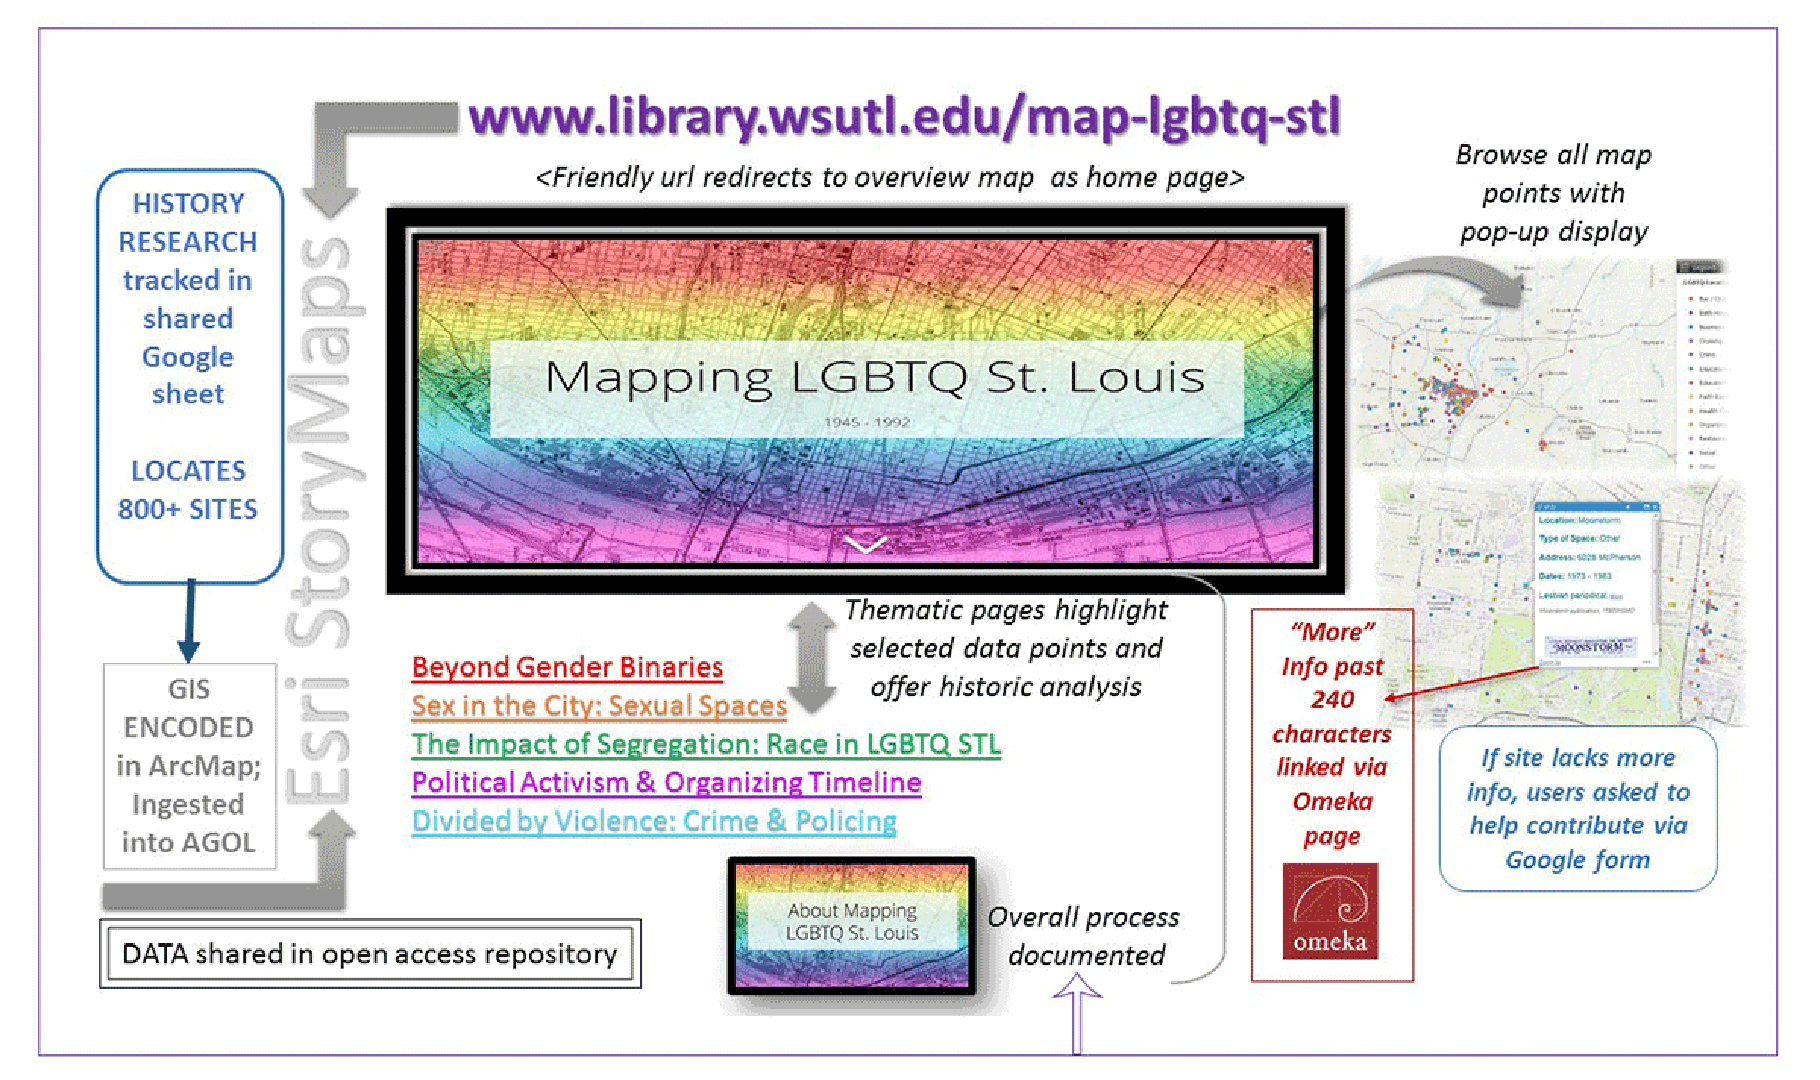
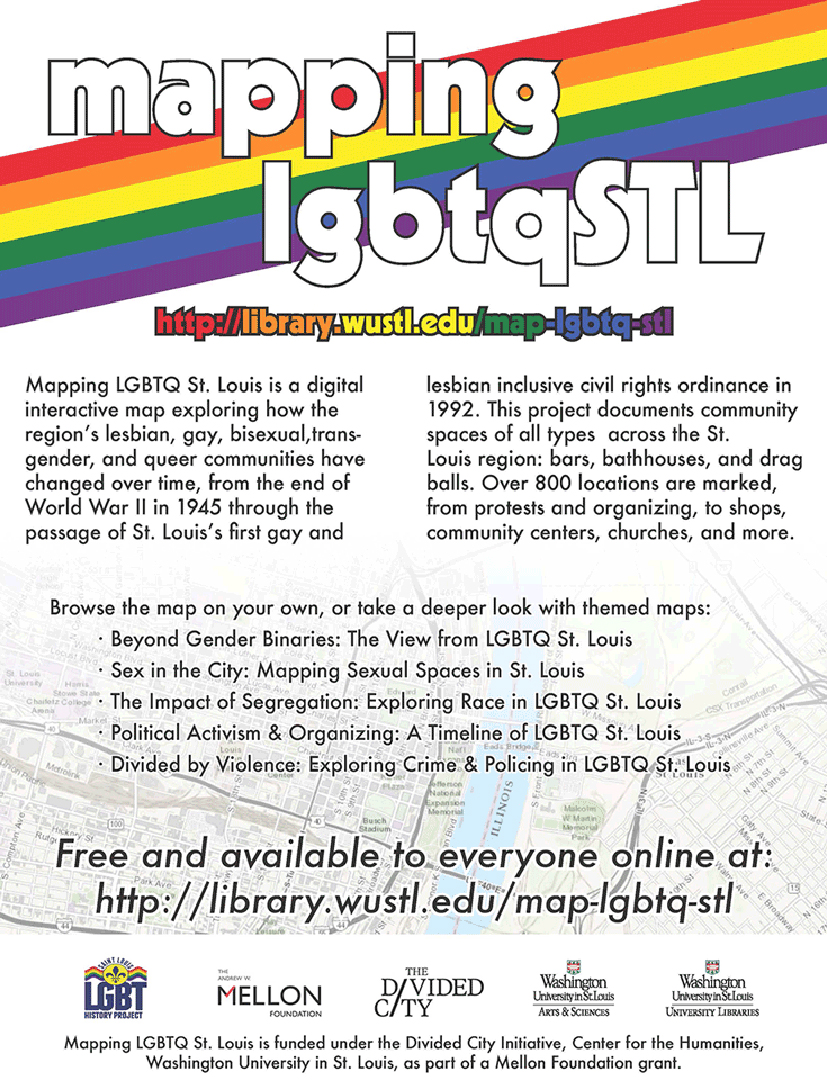
Mapping LGBTQ St. Louis http://library.wustl.edu/map-lgbtq-stl is a digital atlas of the region’s lesbian, gay, bisexual, transgender, queer history from 1945 – 1992. The site, launched publicly October 11, 2017, combines archival documents with GIS data to examine the relationship between metropolitan space and sexual segregation, as well as how LGBTQ St. Louis was divided by race, gender identity and expression, experiences of policing and violence, and socioeconomics. Freely available online, visitors can browse and explore more than 800 locations on the map, or follow several guided thematic tours.
Unlike other heritage mapping projects (most notably California Pride: Mapping LGBTQ Histories https://www.historypin.org/project/469-california-pride/# and NYC LGBT Historic Sites Project http://www.nyclgbtsites.org/#) Mapping LGBTQ St. Louis did not focus on architectural history of sites, nor famous individuals or stories of progress. Rather, using primary sources from multiple archives, we attempted to track any space connected to queer life, as broadly construed, and organize the information into a dataset.
The GIS-compatible dataset is one of the most unique aspects of Mapping. In addition to using this for the creation of the public interface, it is also shared as an open source reusable dataset available to other researchers. By leveraging this historical data, it is hoped that social scientists, medical researchers, and others can gain a greater understanding of a community overlooked in both the past and present.
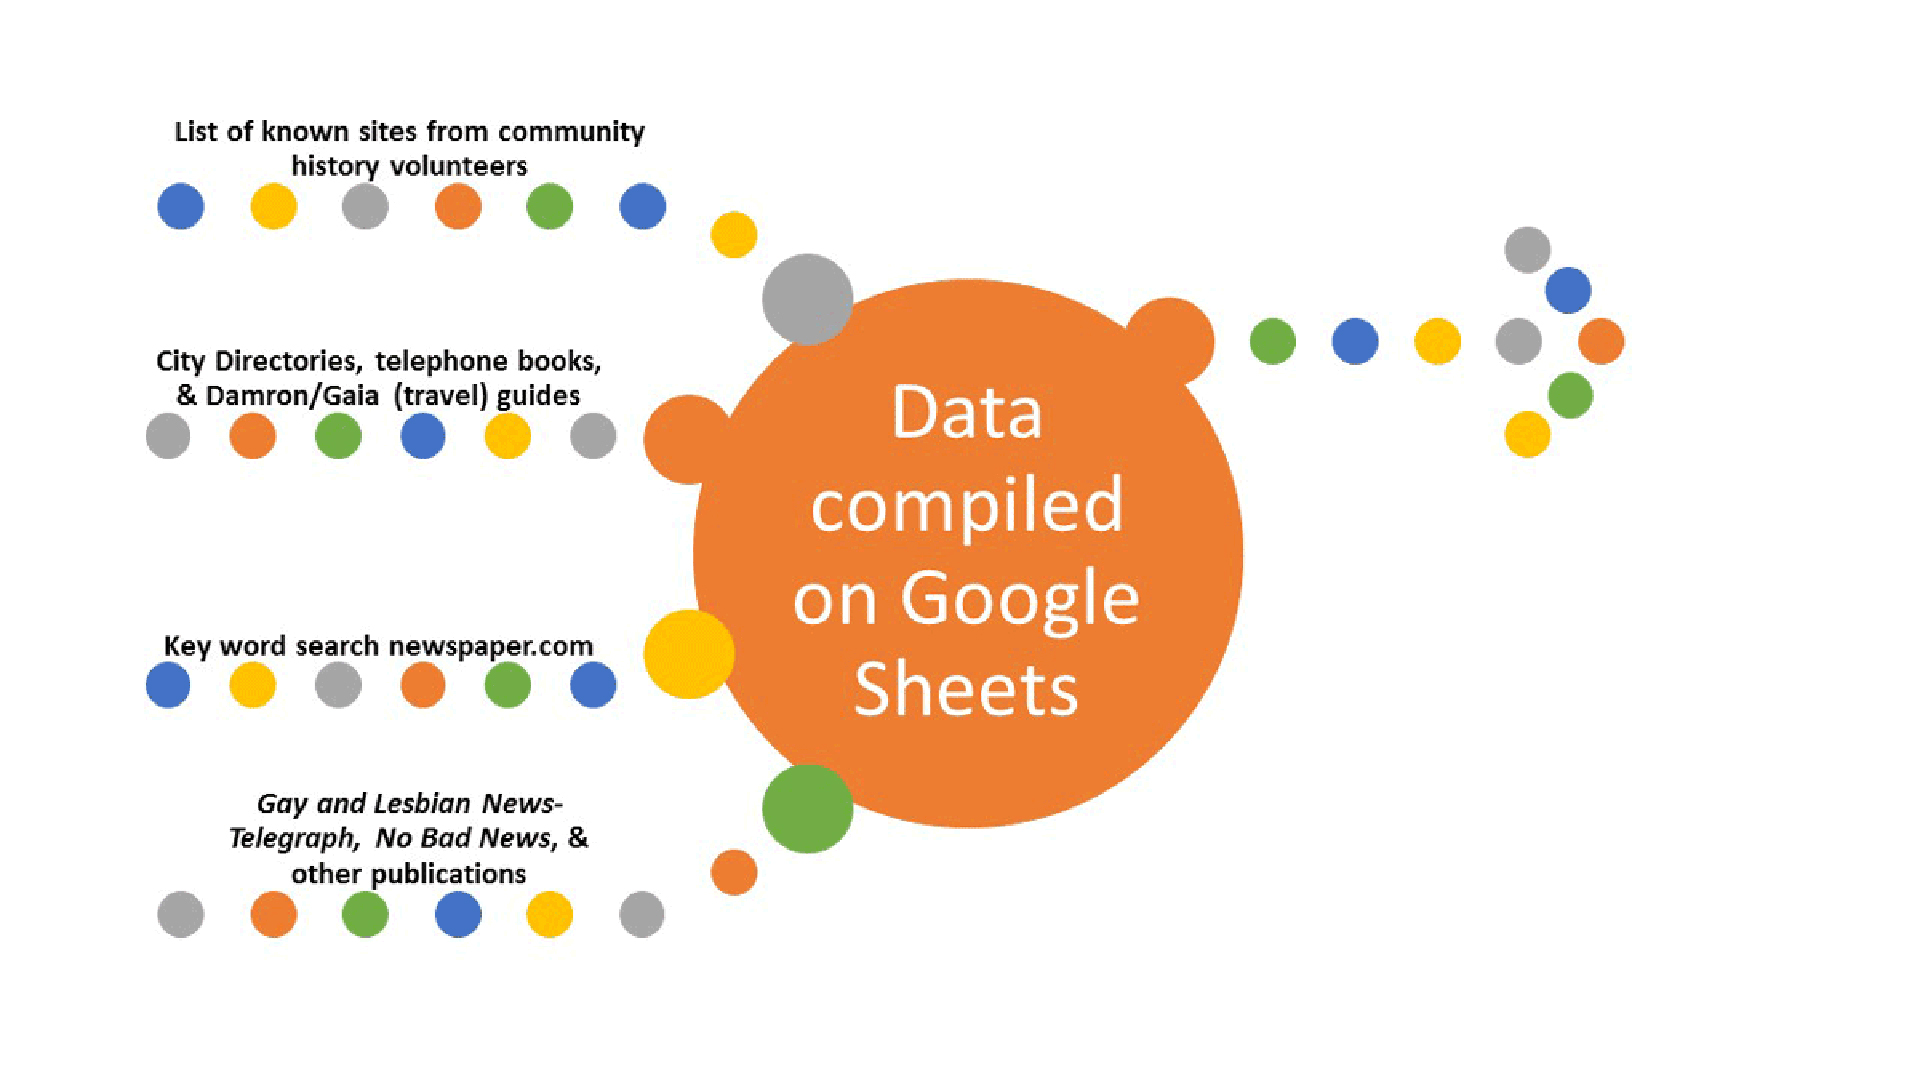
Team members using collaborative Google Sheets compiled location data, including starting and ending dates, along with the gender, sexuality, and race of people commonly within that space. Particular attention was paid to racial categorization, and spaces are identified as predominantly white, predominantly African American, or racially mixed – purposefully confronting the way race, especially whiteness, was (and is) subtly coded. We acknowledged and continually remained cognizant that the common acronym LGBTQ obscures the divisions within and between groups of people. For instance, we checked carefully for contextual information before presuming a space was frequented by those who identified as bisexual, even if commonly frequented by gay men or lesbian women. Similarly, gender non-conforming performers (such as drag kings or queens) were specifically noted, rather than simply including them within the contemporary transgender umbrella. The topic of violence, including police interactions, crimes, and arrests are of particular import to the St. Louis region and LGBTQ communities. Rather than avoid these difficult aspects, they were included in the data and analyzed in contextual tours.
The Esri product “Story Map” was used to create the public interface. To overcome character and image limits, we use Omeka to serve pdf documents with longer descriptions and multiple images. This allows archival documents and images to remain linked with the location data, while keeping the dataset within required parameters. For Mapping spaces with only minimal known data, visitors are redirected to a Google form that allows anonymous submissions and tracks messages into a spreadsheet allowing follow-up.