
Michal Migurski: MSNBC Hurricane Tracker
Artist(s):
Title:
- MSNBC Hurricane Tracker
Exhibition:
Creation Year:
- 2009
Category:
Artist Statement:
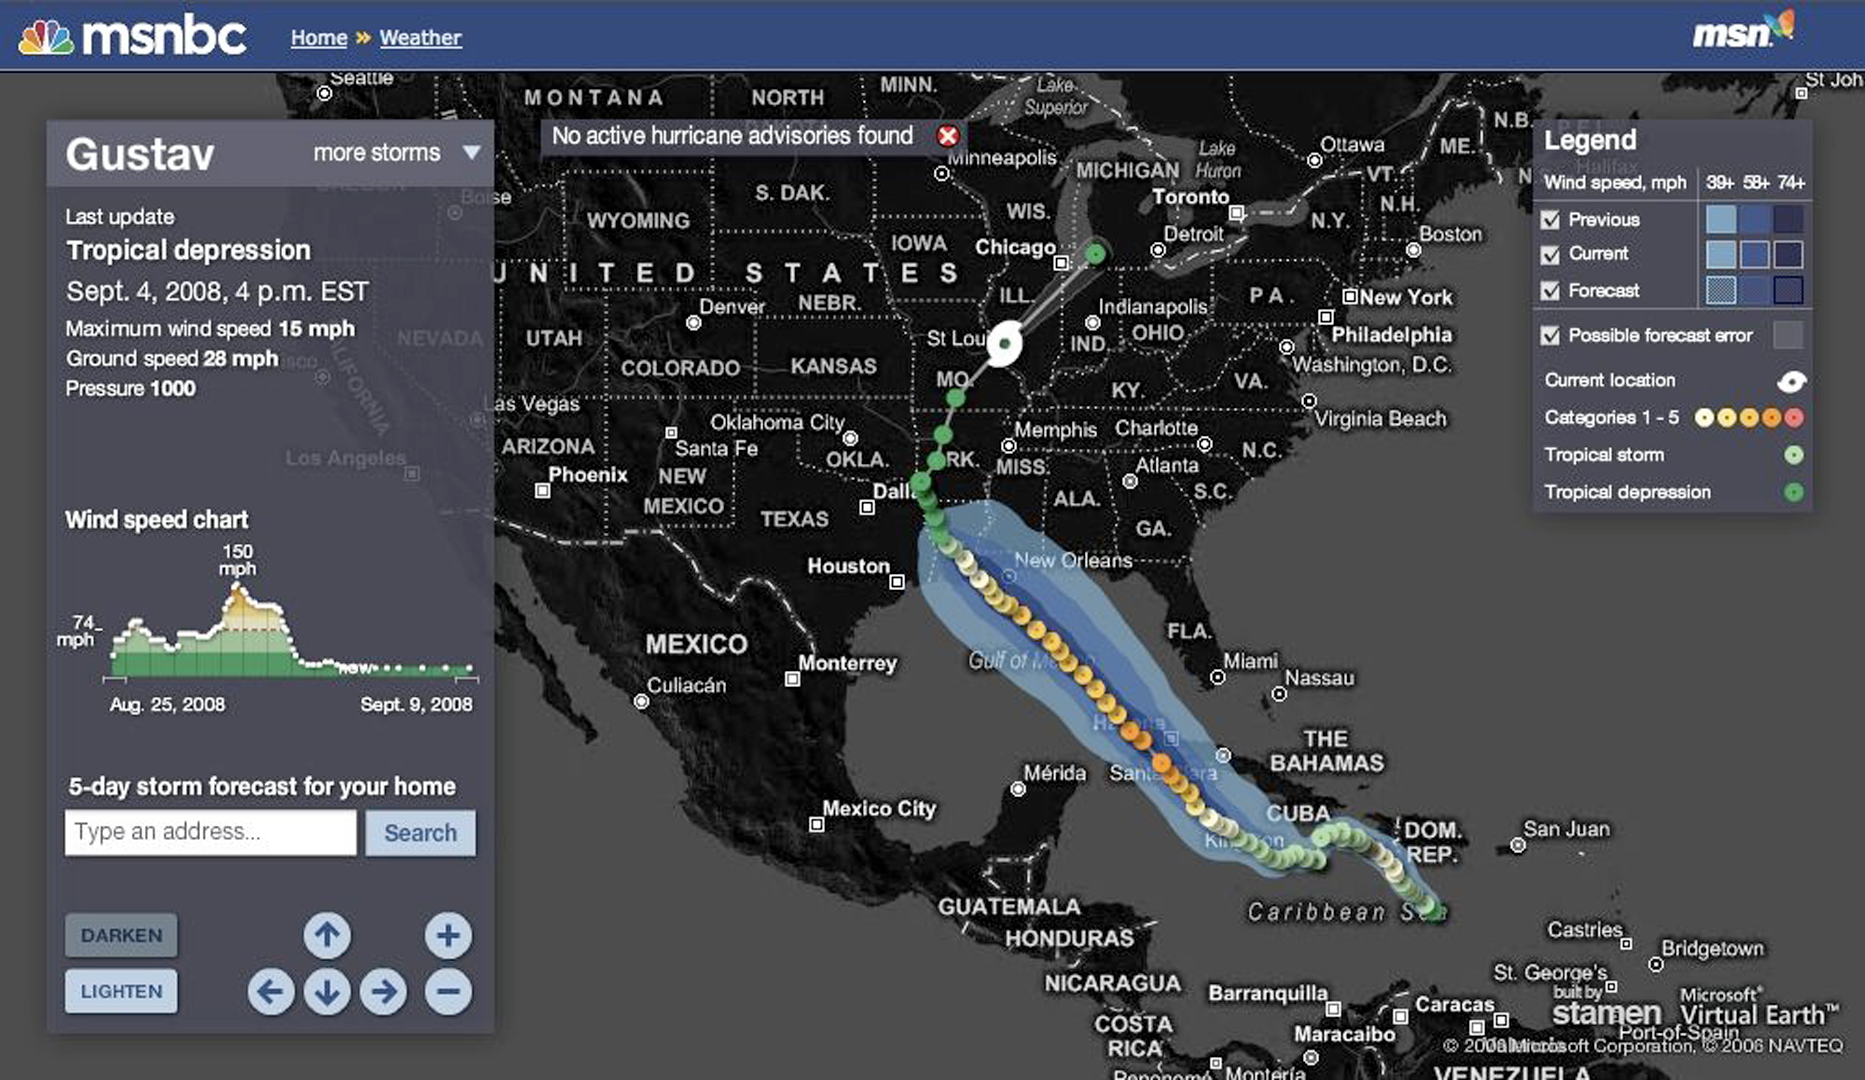
Stamen Design worked with MSNBC and Hurricane Mapping to bring hurricane tracking data from the National Hurricane Center to a larger audience in an interactive, visual form. The data include the past, present, and forecast location of the storm; contours for areas affected by high wind speeds; and the probability of hurricane-force winds throughout the United States.
An introductory animation shows the progression of the storm with an animated hurricane icon moving at a speed proportional to the ground speed of the hurricane. The animation is dynamically generated using the latest hurricane data – a significant improvement on early online hurricane maps, which were either static or generated by hand.
The hurricane data are presented in both chart and map form, and the chart and map are linked interactively so that using the mouse to explore the chart highlights the appropriate area on the map, and vice-versa. This original approach ensures a closer understanding of the relationship between the chart and the map, reinforced by the introductory animation.
The map itself was desaturated and inverted to give a solid dark background to the data, an unusual approach for online maps. The hurricane path and contour data were colored by the strength of winds, with point positions using the standard Saffir Simpson scale and wind-speed contours using solid and textured fills to indicate the difference between known and predicted information.
Stamen’s approach was ultimately focused on bringing together two commodity data layers, Microsoft’s Virtual Earth and the NHC storm tracking data, and making them appropriate and useful in a web context. There are many credible alternatives online, but this unique approach produced a map that is informative, timely, and visually appealing.